Posts

Showing posts from 2017

Business Intelligence Jobs, Skills and Tools Analysis Report

Image
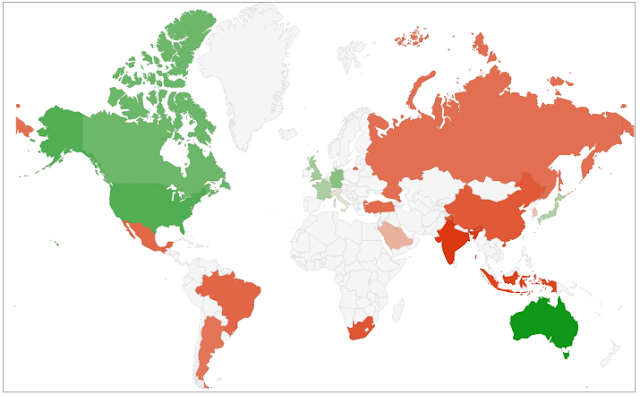
Business Intelligence Jobs, skills and tools analysis report Click on the link above to download the full report. Name :  Business Intelligence Jobs, Skills and Tools Analysis Report Published date : 25th   DEC 2017  Data sources : JobsBI.COM Author/s :  Anoop Kumar V K Licence Type : CC-BY  Tools used : Google Sheets and Google Docs Above screenshot is provided to give an idea about the content of this report. This report is created based on an independent, unsponsored and unbiased exploration and analysis of current trends in Business Intelligence Jobs, skills and BI Tools in demand based on reliable, verifiable and real BI Job requirements. Report covers various aspects such as Minimum educational qualification, types of BI roles, skills and tools in demand. This report is not meant to be a comprehensive report on Business Intelligence Job Trends, Skills or Tools. Also, it is not intended to convey that one role, sk

BI Jobs in Germany by Industry

Image
For full and interactive report click here Carried out analysis of the BI jobs posted in JobsBI.com. Data is valid as of 4th Nov 2017. As of today (12th Nov 2017), more than 800 BI jobs have been posted on JobsBI.com. As of 4th Nov 2017 more than 300 BI jobs in Germany were posted on JobsBI.com. Interesting to see the split of BI Jobs in Germany by Industry and sub-category. This should not be considered as an Industry trend because jobs are posted randomly on JobsBI.com and it does not cover all of the industries equally. Above screenshot does not contain the full set of sub-categories. Author: Anoop Kumar V K Licence Type : CC-BY  (Creative Commons) Data : JobsBI.com as of 4th Nov 2017  Tool used : Tableau Public Created Date : 12th Nov 2017 Interactive version - https://public.tableau.com/profile/anoop.kumar.v.k#!/vizhome/BIJobs/Story1?publish=yes

IPL - Indian Premier League Data Analysis

Image
 Report by Deepak G S For full and interactive report see Indian Premier League Data Analysis Disclaimer: Posted by Reportpedia admin on behalf of Deepak G S.  Reportpedia has not verified the data or the contents of the analysis.  Terms of Use

Will education rescue you from being Obese?

Image
Author : Vishnu Sekhar  Obesity is a concern and to understand the impact of that concern, CBS reports that globally we spend more money to tackle problems due to Obesity than what we spend on the military. Even though the report was from 2012, I am almost sure that trend will be same and the numbers might have climbed up the ladder. To get a gist of the money involved, we spend  $2.1 trillion to fight obesity and $1.75 trillion on the military. That's a staggering amount of money !!!. The dataset I have analyzed this week as part of MakeoverMonday project is what triggered this article. The dataset was from CDC ( Centers for Disease Control and Prevention) and it showed a statistics from the year of 2011 to 2015 for The United States. I looked at the dataset multiple times to come up with an analysis and this often happens when you have a dataset with no particular ask. I got caught up with work and put this aside even though the dataset was available since Monday. Then on

Doing Business 2018 - Reforming to create jobs

World Bank Group has published the Doing Business 2018 - Reforming to create jobs report . Disclaimer: This report and many more such reports are available on the World Bank Group site and  these reports can be downloaded for free from that site. These reports are created by World Bank Group. This post is only to make general public worldwide aware about such a useful source of information. Reportpedia has not contributed to this report. 

G20 members analysis

Image
 I went through the Statistical country profiles of G20 member states, collected data for some of the points that interested me and created a few charts. Here is the link to the semi-interactive charts -  G20 Analysis. Gross National Income - per capita Australia has the highest national gross income per capita. US is second followed by Canada and Germany in the 3rd and 4th place respectively.  India has the lowest per capita among the 20 member states.     The greener, the higher (better) Gross debt as % of its GDP 3 countries (Japan, US and Italy) have debt more than 100% of its own GDP. Percentage of its goods import from China China is the only country present in the list of Top 3 countries from which all other G20 member states import goods.  China is the number one goods exporter for 13 of the G20 member states. India is no where in the list of top 4 countries from which other member states import goods.  The only place where India is

TDWI Checklist Report - 6 Strategies

Six Strategies for Advancing Customer Knowledge with Big Data Analytics Name :  Six Strategies for Advancing Customer Knowledge with Big Data Analytics Author/s : TDWI Disclaimer: This report and many more such reports related to anything to do with Data is available on TDWI site and most of these reports can be downloaded for free from that site. These reports are created by TDWI. This post is only to make general public worldwide aware about such a useful source of information.  Reportpedia has not contributed to the report.

Business Intelligence Tools and Companies

Image
I was just curious to know which countries make most of the popular Business Intelligence Tools and where there headquarters are.  At the moment it looks like it is totally dominated by United States in all categories. Now, I am again curious, why none of the companies in other countries are coming up with BI Tools that are as popular as these? In ETL or Data Integration category there is only one company outside United States. Author: Anoop Kumar V K Licence Type : CC-BY Data : Wikipedia.org for company headquarters information . Data as of 14th October 2017. Tool used : Microstrategy Created Date : 15th October 2017

Global Petroleum Prices

Image
Author : Rajdeep Chatterjee I have visualized the pattern of change in Gasoline Prices across 10 different countries of the world, using Python. Python is an amazing tool to work with and this report not just compares the price variation but also establishes a predictive insight from the data. The data is obtained from Quandl (www.quandl.com). Quandl is a source for financial, economic and alternative datasets delivered in usable formats with suitable APIs for analytic tools like R and Python. The data obtained from Quandl, consisted of several fields like Date, Gasoline Price, Gasoline One-Week Change %, Diesel Price, etc. The data were recorded from Sep. 2016 to Sep. 2017. I processed the data to obtain only the Gasoline Prices and the Dates when they were recorded. The following image shows how the data set for each countried varied. Clearly, in some of the countries the variation in prices was too little, whereas some countries showed considerable variation in

Business Intelligence jobs posted in JobsBI.com

Image
Analyzed the data related to BI jobs that are posted on JobsBI.com using IBM Watson Analytics. IBM Watson Analytics does a great job by coming up with almost all likely questions that can be asked. I liked the connection part the most. Find multi-page pdf version here - Pdf version Please note that this is only a reflection of BI jobs posted in JobsBI.com and should not be considered as a general trend in Business Intelligence Jobs. Also the decreasing trend in the number of jobs posted is not because of decrease in number of BI jobs but because of lack of time to post the jobs. 272 BI jobs have over 100 (105) different Job roles or titles . One thing is for sure, there is no consistency in the Job titles across companies. Each company (sometimes each department within the same company) uses different titles. If you compare two job descriptions with the same title you will notice that the job descriptions don't match and it is also true the other way around, that is same job de

Indians imprisoned in other countries

Image
Name            : Indians imprisoned in other countries Created date  : 3rd Oct 2017 Data source   :  http://www.mea.gov.in/ Author/s : Gopal N Biradar (@biradar_gopal)    Licence Type : BY-NC-SA Created using : Tableau Category : National Additional Information :  http://www.mea.gov.in/lok-sabha.htm?dtl/28819/QUESTION_NO3907_INDIAN_PRISONERS_ABROAD

No of companies registered in the last 30 days in India

Image
Name            : No of companies registered in the last 30 days in India Created date  : 29th Sep 2017 Data source   :  mca.gov.in Author/s          :  Anoop Kumar  V K     Licence Type :  BY-NC-SA Created using :  Tableau Categories       : Companies, India A report that shows state-wise number of companies incorporated in India in the last 30 days.