Global Petroleum Prices
The data is obtained from Quandl (www.quandl.com). Quandl is a source for financial, economic and alternative datasets delivered in usable formats with suitable APIs for analytic tools like R and Python.
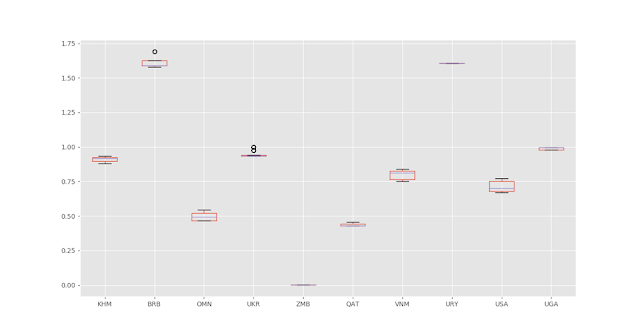
The data obtained from Quandl, consisted of several fields like Date, Gasoline Price, Gasoline One-Week Change %, Diesel Price, etc. The data were recorded from Sep. 2016 to Sep. 2017. I processed the data to obtain only the Gasoline Prices and the Dates when they were recorded. The following image shows how the data set for each countried varied.
Clearly, in some of the countries the variation in prices was too little, whereas some countries showed considerable variation in prices. So, I chose to correlate the variation and here's how the
percentage variation of Gasoline Prices across the countries look like.
As we can observe, the variation in price is maximum for Oman, followed by USA. However USA shows a more random variation. So, I analysed the price variation for USA and obtained the following best fit regression.
Now that I obtained a regression curve, I went on to predict the Gasoline Prices for October, November and December. Here's what I obtained.
Well, it appears the Gasoline Prices for USA might decrease by December 2017. Clearly, this is not an extremely accurate result as there are a lot of other factors (Predictors) that affect the prices and even the dataset is not large enough to impose a strong confidence value over my machine's prediction. However, this result is quite helpful to obtain an overview of the trend in the price pattern of Gasoline across the globe and can be effectively utilised.


Comments
Post a Comment